Gaussen Language
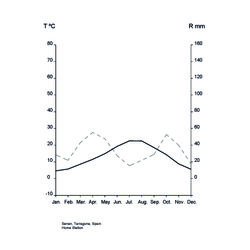
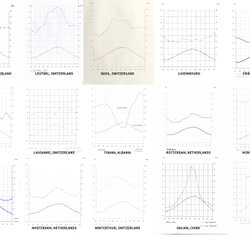
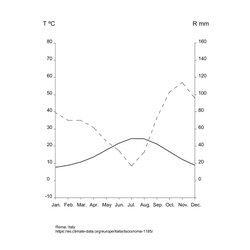
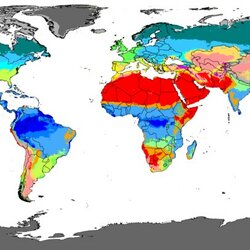
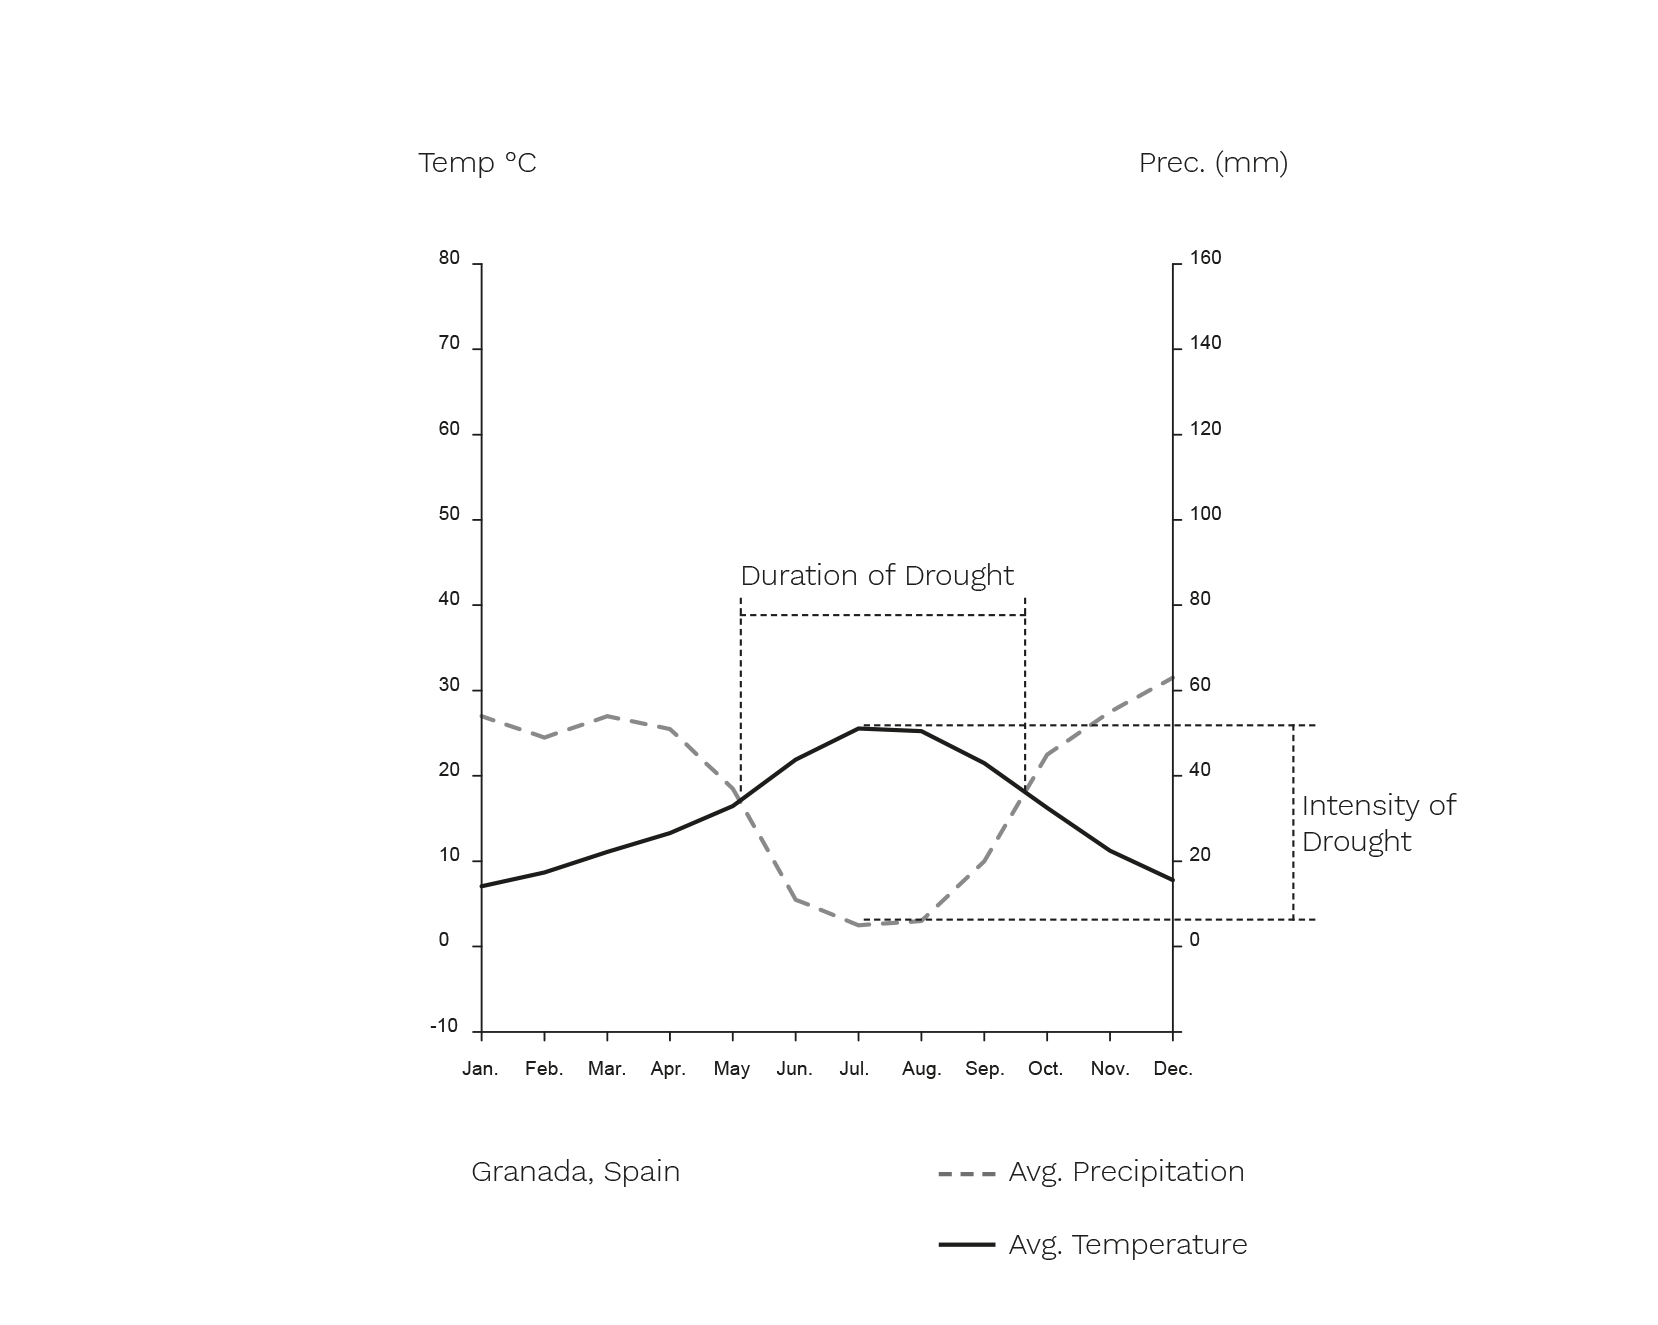
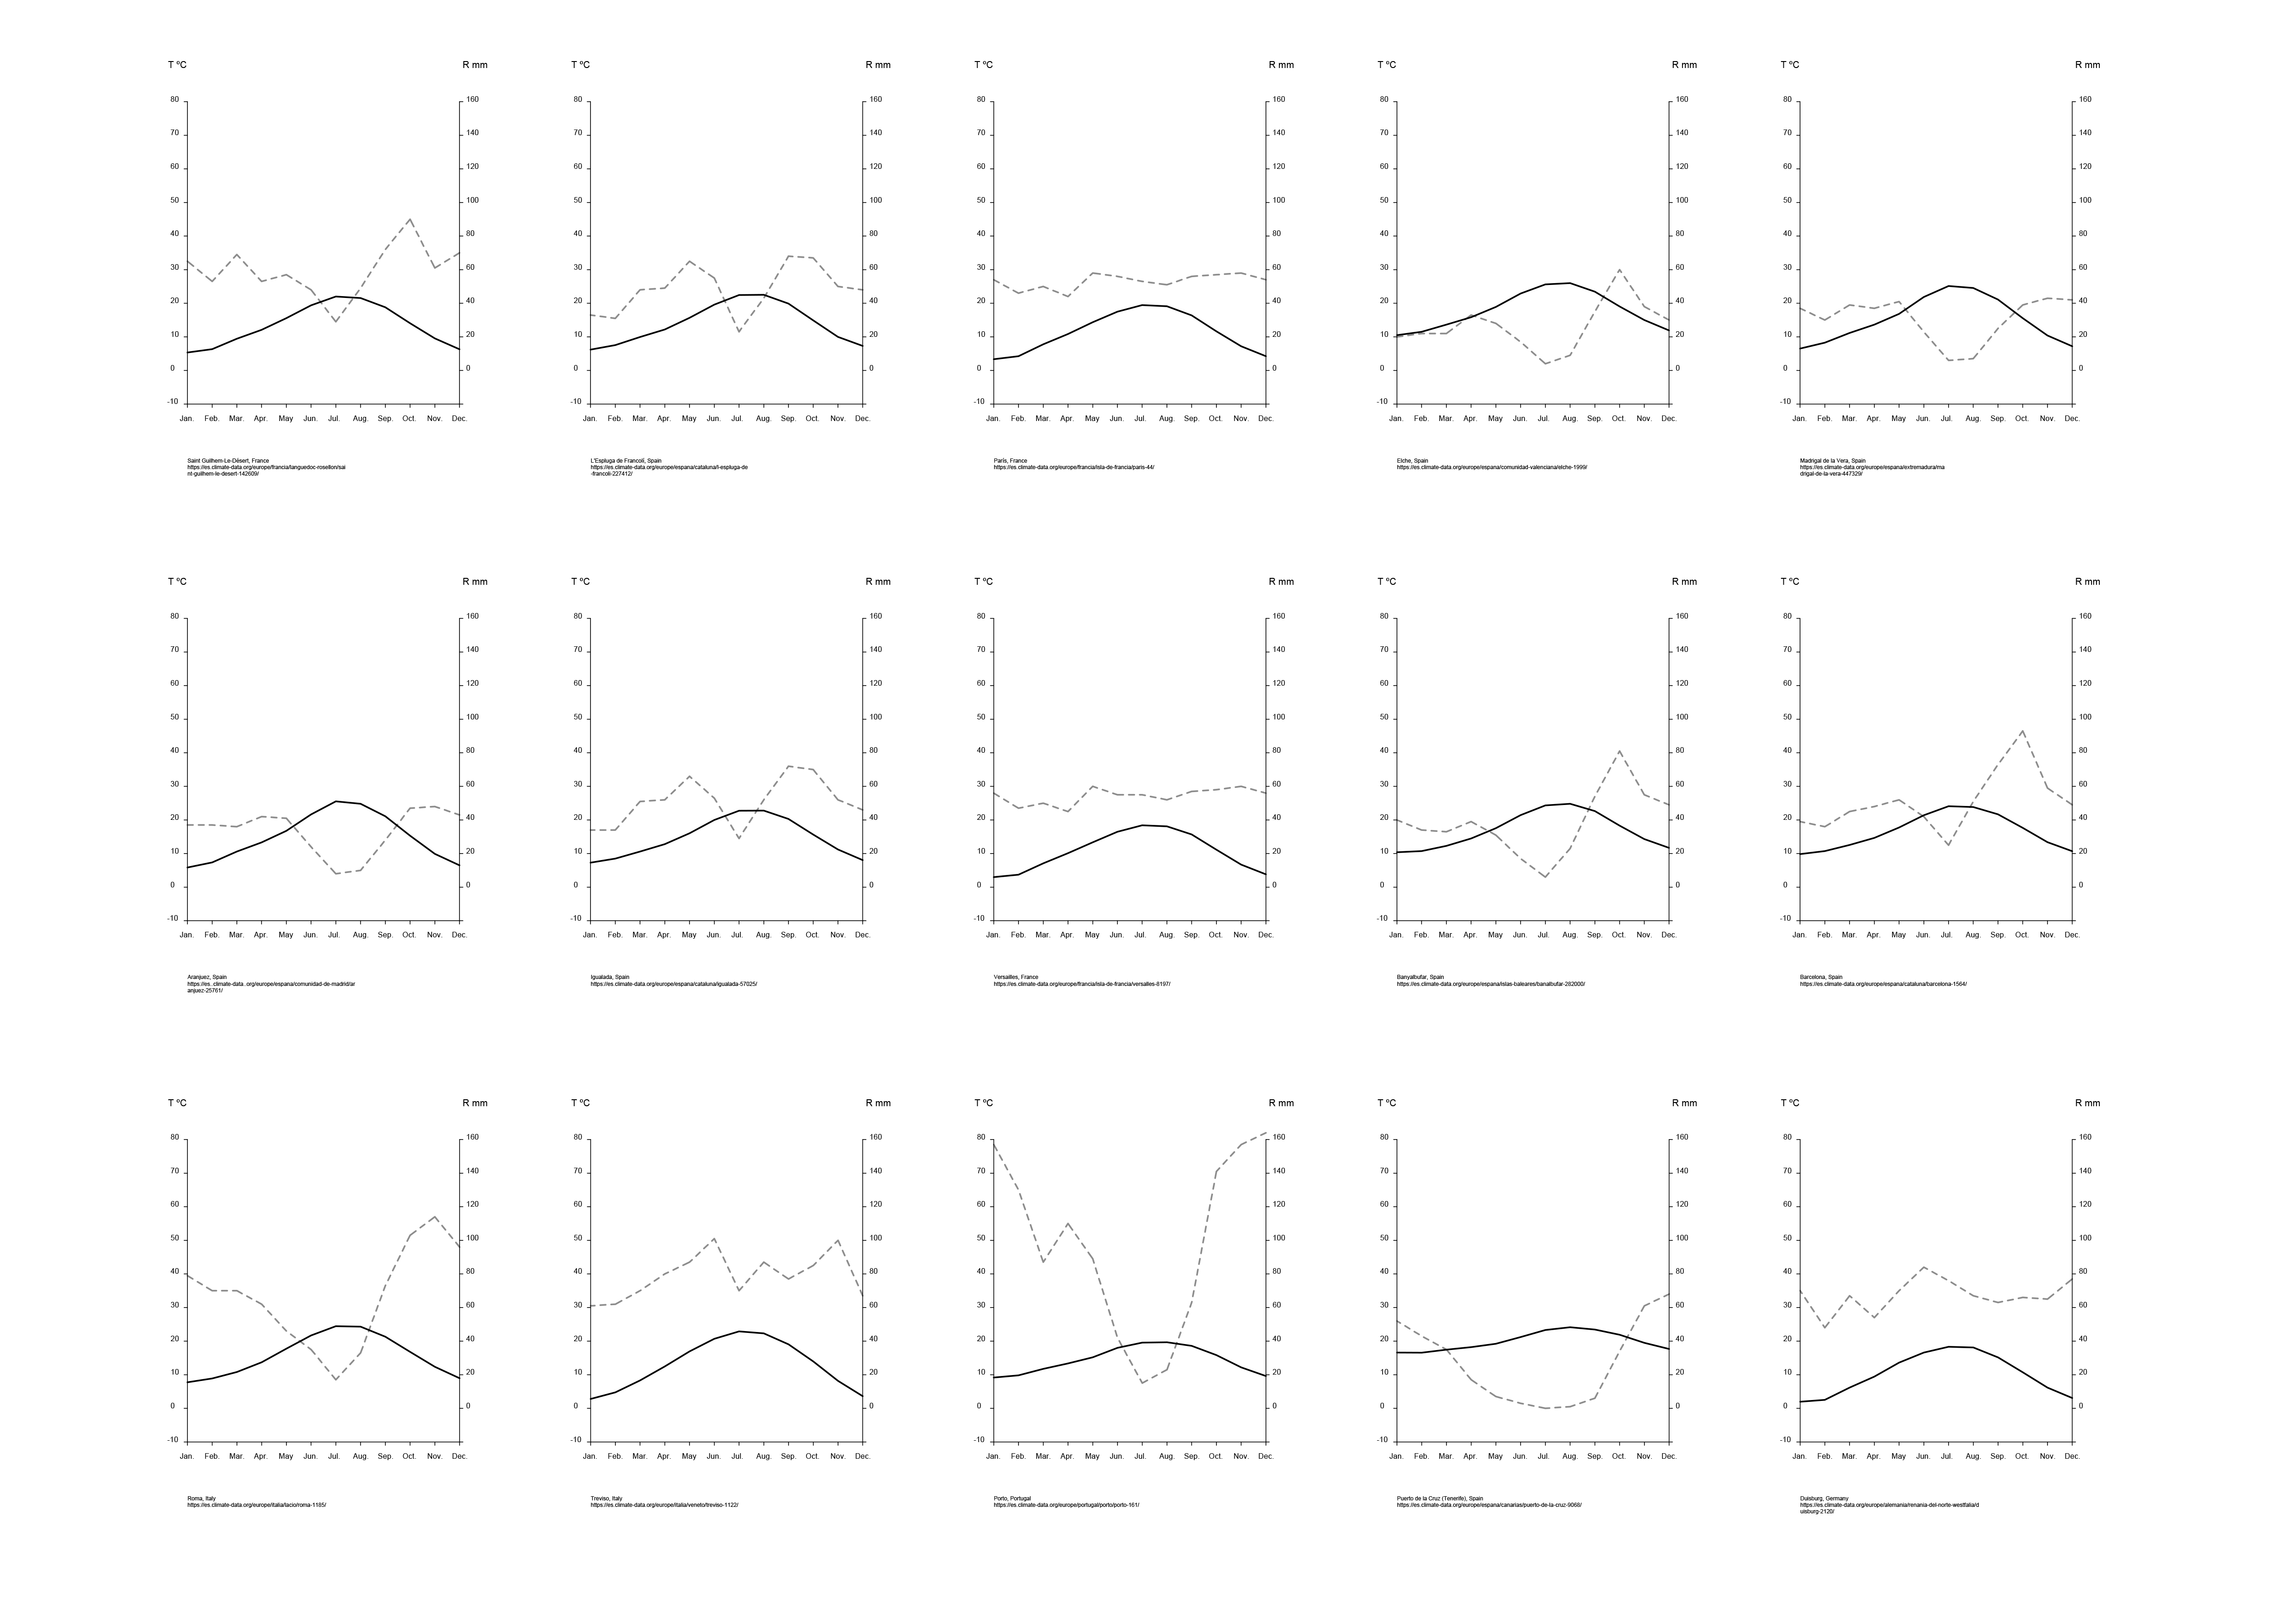
The Gaussen diagram is a way to quickly visualize the climate of a region, especially in terms of vegetation. The diagram sets up a relationship between temperature and precipitation, so you can see the degree and duration of drought (a very important limiting factor for plant growth). If the two lines never cross, there is no drought in that region.
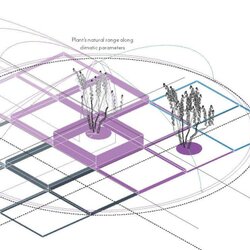
Making a Gaussen diagram for each site can be a generative design tool — it helps to envision the types of plants that may grow there and understanding how its climate relates to other parts of the world. Monthly averages for climate data can be found on various websites. Locations in Europe can often be found at www.climate-data.org. It's important that the data be averaged over at least 10 years.
For more information, see Filippi, O. (2019), The Dry Gardening Handbook: Plants and Practices for a Changing Climate. P. 41
For more information, see Filippi, O. (2019), The Dry Gardening Handbook: Plants and Practices for a Changing Climate. P. 41